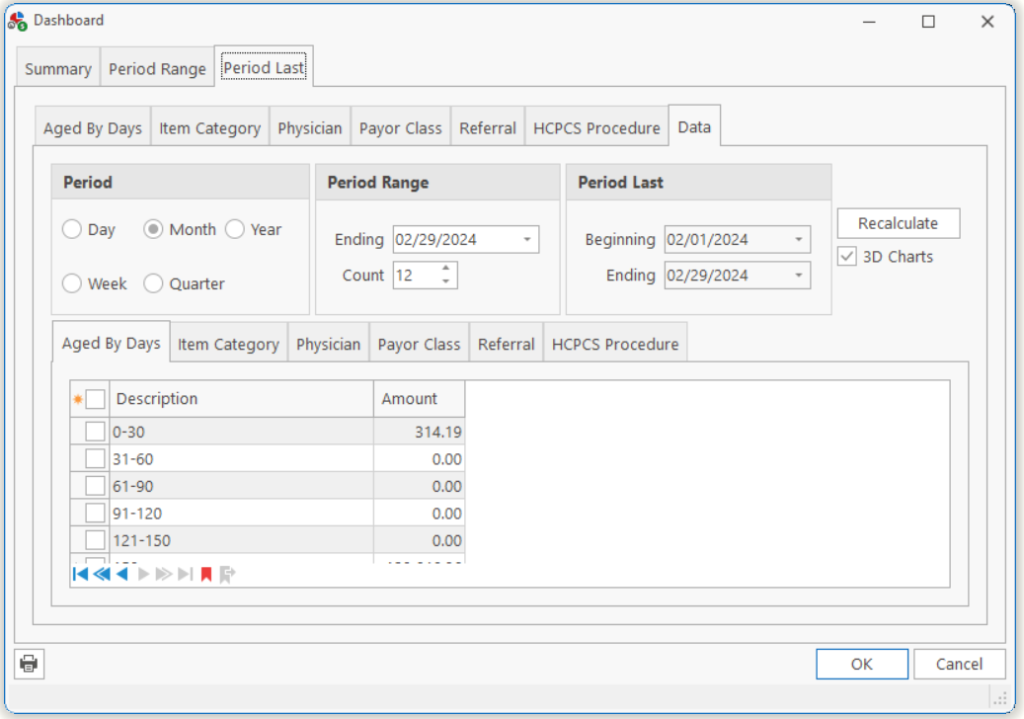
The Data Tab under Period Range or Period Last shows the data used to create the charts on the tab. The user can also change the Period Range or Period Last here.
| Period | The type of Period the user wants the charts to reflect. |
| Period Range | The Period Range Ending date and the number of Periods the user wants the charts to reflect. The works in concert with the Period to determine the range reported.
Example: The user chooses Month, 12/31/2006 and 24. This would show 24 months of data ending with 12/2006. |
| Period Last | The Period Last date range cannot be changed directly but represents the last period of the range selected in Period Range. |
| Recalculate | Click this button to recalculate the data tabs and change the graphs and charts. |
| 3D Charts | This displays the charts in 3D or 2D format. |
| Export data | The user can export the data and analyze it in your spreadsheet, right-click on the grid and choose Export. You will be asked the filename you intend to create. You can then import this file into your spreadsheet using its import feature. |
Note: The Data Tab selection on the Period Range and the Period Last tabs are connected. Changing one will automatically change the other.
Tell us what you think.
You must be logged in to post a comment.